SIMPLY BETTER BRANDS CORP. ANNOUNCES YEAR END 2022 FINANCIAL RESULTS OUTPERFORMING OUTLOOK AT $65.4 MILLION IN REVENUE, 68% GROSS MARGIN, AND $1.2 MILLION IN ADJUSTED EBITDA
Ryan Allway
May 4th, 2023
News, Top News
306% growth capturing channel, category, and innovation in clean-ingredient food, next generation skincare, and plant-based wellness
VANCOUVER, BC , May 4, 2023 /CNW/ – Simply Better Brands Corp. (“SBBC” or the “Company”) (TSXV: SBBC) (OTCQB: PKANF) is pleased to announce its unaudited financial results for the year ended December 31, 2022. All amounts are expressed in United States dollars unless otherwise noted. Certain metrics, including those expressed on an adjusted basis, are non-International Financial Reporting Standards (“IFRS”) measures, see “Non-IFRS Measures” below. The Company expected to file its audited financial statements for the year ended December 31, 2022 and management discussion and analysis shortly.
2022 YEAR KEY COMMERCIAL ACHIEVEMENTS
- TRUBAR Protein Bar: In additional to supporting a U.S. and Canadian-based retailers base, TRUBAR was able to expand into roughly 50% of U.S. and Canadian Costco Clubs throughout 2022. As TRUBAR exceeded the bar category sales velocities at Costco, TRUBAR is currently in national distribution at Costco. Supporting the brands continued expansion are four initiatives: manufacturing capacity expansion, continued omni-channel distribution growth, bar flavor extensions, and the entry into the $8 billion protein powder category in 2023.
- PureKana Wellness: PureKana, a leading plant-based wellness brand, remained focused on a its customer acquisition initiative, adding over 18,700 customers per month and enabling the sales funnel into a subscription model. To expand beyond human consumption, PureKana announced its 2023 entry into the $196 million hemp-based pet category with offerings in with calming chews, hip & joint chews, and hair & coat drops. As an estimated 60% of PureKana’s loyal customers have pets, the growth opportunity is sizeable.
- No B.S. Skincare: Originally, the No B.S. brand was sourced exclusively online at livenobs.com and Amazon. In 2022, the brand entered 3,200 CVS Health stores for a Back-to-School Event and continues to maintain a on shelf presence in CVS’s healthy skin section. Initial brick and mortar success has the brand slotted to enter an additional large, national chain in summer 2023. Sources of growth include omni-channel expansion supported by insight-driven innovation with an expanded facial acne patch portfolio (overnight pimple patch and acne patch plus retinol night cream) and a natural deodorant category entry.
- Vibez Wellness: The Vibez Wellness line was launched in November 2022 to capture incremental millennial consumers on their preventative wellness journey. With an initial keto gummy supplement offering, the brand achieved $1.4M in revenue in the first 60 days of launch. Vibez’s primary focus is non-CBD solutions into the weight management, focal acuity, and healthy hair consumer need states.
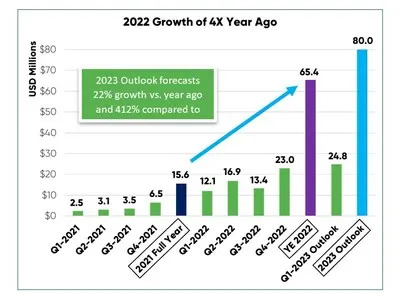
“As our strong 2022 financial and commercial results illustrate, we are positioned for continued revenue growth, profit improvement, and debt reduction in 2023. Our strategic priorities remain to lead consumer-centric innovation and relentlessly acquire customers to these emerging brands by driving category and channel expansion. With our recent $7 million finance raise, we are aptly fueled to deliver the 2023 outlook of $80 million in revenue and $3-4 million in adjusted EBITDA at a gross margin target range of 58-60%,” says SBBC CEO, Kathy Casey.
UNAUDITED FINANCIAL HIGHLIGHTS FOR YEAR ENDED DECEMBER 31, 2021
For the twelve months ended December 31, 2022, the Company generated revenue of $65.4 million with a gross profit of $44.6 million (68%) compared to $15.6 million with a gross profit of $9.7 million (62%) during the twelve months ended December 31, 2021. Revenue increased by $49.8 million (319% increase) over the prior year’s revenues.
Operating costs for the twelve months ended December 31, 2022, were $54.3 million, an increase of $34.8 million (178%), compared to $19.5 million for the twelve months ended December 31, 2021.
During the twelve months ended December 31, 2022, the Company recorded a net loss of $11.1 million compared to a net loss of $12.8 million for the twelve months ended December 31, 2021.
For the three months ended December 31, 2022, the Company generated revenue of $23.0 million with a gross profit of $16.1 million (70%) compared to $6.5 million with a gross profit of $4.3 million (66%) during the three months ended December 31, 2021. Revenue increased by $16.5 million (254% increase) over the prior period’s revenues.
Operating costs for the three months ended December 31, 2022, were $19.9 million, an increase of $13.0 million (188%), compared to $6.9 million for the three months ended December 31, 2021.
During the three months ended December 31, 2022, the Company recorded a net loss of $4.2 million compared to a net loss of $4.2 million for the three months ended December 31, 2021.
Non-IFRS Measures (Earnings before Interest, Taxes, Depreciation, and Amortization (“EBITDA”) and Adjusted EBITDA)
EBITDA and Adjusted EBITDA are non-IFRS measures used by management that are not defined by IFRS. EBITDA and Adjusted EBITDA do not have a standardized meaning prescribed by IFRS and therefore may not be comparable to similar measures presented by other issuers. Management believes that EBITDA and Adjusted EBITDA provide meaningful and useful financial information as these measures demonstrate the operating performance of the business excluding non-cash charges.
The most directly comparable measure to EBITDA and Adjusted EBITDA calculated in accordance with IFRS is net loss. The following table presents the EBITDA and Adjusted EBITDA for the twelve months ended December 31, 2022, and 2021, and a reconciliation of same to net income (loss):
| For the years ended | ||||
| December 31, 2022 (unaudited) |
December 31, 2021 (audited) |
Change in | ||
| $ | $ | $ | % | |
| Net loss | (11.10) | (12.80) | 1.70 | (15 %) |
| Amortization | 4.70 | 0.60 | 4.10 | 87 % |
| Depreciation | 0.10 | 0.10 | – | – |
| Finance costs | 1.40 | 2.30 | (0.90) | (64 %) |
| Income tax recovery | (1.00) | – | (1.00) | 100 % |
| EBITDA | (5.90) | (9.80) | 3.90 | 108 % |
| Acquisition-related costs | 0.20 | – | 0.20 | 100 % |
| Acquisition costs paid by common shares | 0.20 | 0.40 | (0.20) | (100 %) |
| Fair value adjustment of derivative liability | (0.10) | (1.20) | 1.10 | (1,100 %) |
| Impairment of intangible assets | 0.40 | 2.50 | (2.10) | (525 %) |
| Impairment of inventories | 0.20 | – | 0.20 | 100 % |
| Impairment of plant and equipment | 0.20 | – | 0.20 | 100 % |
| Impairment of receivable | 0.10 | 0.10 | – | – |
| Gain on debt forgiveness | – | (0.20) | 0.20 | 100 % |
| Gain on remeasurement of the provision of earn-out payments |
– | (0.90) | 0.90 | 100 % |
| Gain on settlement of the milestone shares | (0.40) | – | (0.40) | 100 % |
| Share-based payments | 4.30 | 5.60 | (1.30) | (30 %) |
| Consulting fees to be paid by shares | 0.30 | – | 0.30 | 100 % |
| Shares issued for services | 0.40 | 0.20 | 0.20 | 50 % |
| Warrants issued for services | 0.10 | – | 0.10 | 100 % |
| Write-off of advance payments | 0.50 | – | 0.50 | 100 % |
| Non-recurring expenses | 0.70 | – | 0.70 | 100 % |
| Adjusted EBITDA | 1.20 | (3.30) | 4.50 | (597 %) |
The Company has an adjusted EBITDA of $1.2 million for the year ended December 31, 2022, an increase of $4.5 million over the adjusted EBITDA loss for the comparable period in 2021.
| For the three months ended | ||||
| December 31, 2022 (unaudited) |
December 31, 2021 (audited) |
Change in | ||
| $ | $ | $ | % | |
| Net loss | (4.20) | (4.20) | – | – |
| Amortization | 3.30 | 0.20 | 3.10 | 94 % |
| Finance costs | 0.50 | 0.50 | – | – |
| Income tax recovery | (1.00) | – | (1.00) | 100 % |
| EBITDA | (1.40) | (3.50) | 2.10 | 194 % |
| Fair value adjustment of derivative liability | – | (0.40) | 0.40 | 100 % |
| Impairment of intangible assets | 0.40 | 2.50 | (2.10) | (525 %) |
| Impairment of inventories | 0.20 | – | 0.20 | 100 % |
| Impairment of plant and equipment | 0.20 | – | 0.20 | 100 % |
| Impairment of receivable | – | 0.10 | (0.10) | 100 % |
| Gain on debt forgiveness | – | (0.20) | 0.20 | 100 % |
| Gain on remeasurement of the provision of earn-out payments |
– | (0.90) | 0.90 | 100 % |
| Share-based payments | 0.80 | 1.20 | (0.40) | (50 %) |
| Consulting fees to be paid by shares | 0.30 | – | 0.30 | 100 % |
| Shares issued for services | (0.10) | 0.10 | (0.20) | 200 % |
| Warrants issued for services | 0.10 | – | 0.10 | 100 % |
| Write-off of advance payments | 0.10 | – | 0.10 | 100 % |
| Adjusted EBITDA | 0.60 | (1.10) | 1.70 | 719 % |
The Company generated positive adjusted EBITDA of $0.6 million for the three months ended December 31, 2022, an increase of $1.7 million over the adjusted EBITDA loss for the comparable period in 2021.
Readers are cautioned that EBITDA and Adjusted EBITDA should not be construed as an alternative to net income as determined under IFRS; nor as an indicator of financial performance as determined by IFRS; nor a calculation of cash flow from operating activities as determined under IFRS; nor as a measure of liquidity and cash flow under IFRS. The Company’s method of calculating EBITDA and Adjusted EBITDA may differ from methods used by other companies and, accordingly, the Company’s EBITDA and Adjusted EBITDA may not be comparable to similar measures used by any other company. Except as otherwise indicated, EBITDA and Adjusted EBITDA are calculated and disclosed by SBBC on a consistent basis from period to period. Specific adjusting items may only be relevant in certain periods.
See also Earnings before Interest, Taxes, Depreciation, and Amortization (“EBITDA”) and Adjusted EBITDA (Non-GAAP Measures) in the Company’s management discussion and analysis for the year ended December 31, 2022 available on SEDAR at www.sedar.com.
Liquidity and Capital Resources
The Company’s primary liquidity and capital requirements are for inventory and general corporate working capital purposes. The Company had a cash balance of $2.3 million as of December 31, 2022, which will provide capital to support the planned growth of the business and for general corporate working capital purposes. The Company’s working capital deficiency decreased from $11.8 million as of December 31, 2021, to a working capital deficiency of $9.3 million as of December 31, 2022 ($2.5 million decrease). Working capital deficiency included the Mainstreet loan ($10.3 million) which is classified as current whereas the term is for 5 years maturing in December 2025. The Mainstreet loan has a five-year term with principal repayments due to start in December 2023 with the first $1.5 million principal repayment. This loan has several covenants including annual and quarterly reporting and debt service coverage. The Company was not compliant with the debt service covenant as of December 31, 2022 although it made progress in improving the Adjusted EBITDA performance of Purekana LLC during the year. For example, adjusted EBITDA reported for Purekana LLC for the year ended December 31, 2022 was $1.4 million compared to an adjusted EBITDA loss of $1.4 million for the year ended December 31, 2021 or a $2.8 million improvement. No notice of default has been received by the Company as of the date of this news release and the Company has been paying the interest on a regular basis. It has been classified as current as a result of the noncompliance with the debt service covenant.
The Company continues to focus on improving its working capital position through a number of initiatives including equity and convertible debt private placements, issuance of promissory notes and establishment of lines of credit for its subsidiaries.
Private Placements
The Company completed a private placement raise in August of 2022 and raised CA$3,990,844 ($3,069,880) in common shares and convertible debentures. The funds raised were used for debt reduction and working capital.
Subsequent to the year ended December 31, 2022, The Company raised an additional CA$7,000,000 in equity to be used for further debt reduction, working capital and for growth initiatives in 2023.
Convertible Debentures
During the year ended December 31, 2022, the Company reduced the balance of convertible debentures outstanding by $1.0 million. Subsequent to the year ended December 31, 2022, The Company paid down $1.7 million in convertible debentures including accrued interest that were due in February 2023.
Line of Credit Facilities
The Company has secured several lines of credit facilities for three of its subsidiaries to support the financing of purchase orders from key customers. These lines of credit have been critical to finance the large retail purchase orders the Company’s subsidiaries have successfully generated during the year ended December 31, 2022. For more information of the line of credit facilities please refer to note 10 in the financial statements for the year ended December 31, 2022. During the year ended December 31, 2022, the Company raised over $8 million in funds from these lines of credit to finance purchase orders from its large retail customers. Over the same period, the Company repaid over $5.9 million of these credit facilities to the lender. TRU was able to increase its primary line of credit with this lender to $6 million in December 2022. The nature of these loans is to turnover between 3-5 months from the time the money is advanced to repayment.
Promissory Notes
During the year ended December 31, 2022, the Company reduced the balance of promissory notes outstanding by approximately $3.5 million. All promissory notes paid off during the year had a maturity less than 12 months.
The Company was able to secure a $1 million promissory note with a duration of 42 months during the year for debt reduction and working capital. The loan bears 15% interest per annum and will be repaid over 42-months starting November 15, 2022.
The Company entered into an agreement with the third party to settle the payment of the assigned portion of the PK Promissory Notes ($1,166,168). The Company made payments totaling $350,000 to the assigned portion of the PK Promissory Notes during the year. The agreement calls for monthly payments of $50,000 which began on December 15, 2022, and continues until the $1,166,168 amount is paid in full. The note bears an interest rate of 6%.
2023 OUTLOOK
For our 2023 Outlook:
- The Company’s expectation for consolidated net sales to exceed $80 million.
- The Company expects gross margin as a percentage of net sales to be between 58% and 60%.
- The Company expects to achieve positive Adjusted EBITDA in the range of $3-4 million.
The Company is also reported on preliminary sales for the first quarter of fiscal 2023 of $24.8 million compared to $12.1 million in Q1 2022 or a 205% increase. Preliminary gross profit for the first quarter of 2023 is 55% compared to 66% in the first quarter of 2022. The lower gross margin is due to sales channel mix as a larger portion of sales to retailers compared to the prior year’s predominantly online sales delivery.
About Simply Better Brands Corp.
Simply Better Brands Corp. leads an international omni-channel platform with diversified assets in the emerging plant-based and holistic wellness consumer product categories. The Company’s mission is focused on leading innovation for the informed Millennial and Generation Z generations in the rapidly growing plant-based, natural, and clean ingredient space. The Company continues to focus on expansion into high-growth consumer product categories including plant-based food, clean ingredient skincare and plant-based wellness. For more information on Simply Better Brands Corp., please visit: https://www.simplybetterbrands.com/investor-relations.
Neither the TSX Venture Exchange nor its Regulation Services Provider (as that term is defined in the policies of the TSX Venture Exchange) accepts responsibility for the adequacy or accuracy of this release.
Forward-Looking Information
Certain statements contained in this news release constitute “forward-looking information” and “forward looking statements” as such terms are used in applicable Canadian securities laws. Forward-looking statements and information are based on plans, expectations and estimates of management at the date the information is provided and are subject to certain factors and assumptions, including, among others, that the Company’s financial condition and development plans do not change as a result of unforeseen events, the impact of the COVID-19 pandemic, the regulatory climate in which the Company operates, and the Company’s ability to execute on its business plans. Specifically, this news release contains forward-looking statements relating to, but not limited to: entry into the $8 billion protein powder category in 2023, expansion plans for TRU Brands products, filing of the Company’s audited financial statements for the year ended December 31, 2022 and management discussion and analysis and, success of the Company’s marketing efforts.
Forward-looking statements and information are subject to a variety of risks and uncertainties and other factors that could cause plans, estimates and actual results to vary materially from those projected in such forward-looking statements and information. Factors that could cause the forward-looking statements and information in this news release to change or to be inaccurate include, but are not limited to, the risk that any of the assumptions referred to prove not to be valid or reliable, that occurrences such as those referred to above are realized and result in delays, or cessation in planned work, that the Company’s financial condition and development plans change, ability to obtain necessary regulatory approvals for proposed transactions, as well as the other risks and uncertainties applicable to the plant-based food, clean ingredient skincare and plant-based wellness or broader wellness industries and to the Company, and as set forth in the Company’s annual information form available under the Company’s profile at www.sedar.com.
The above summary of assumptions and risks related to forward-looking statements in this news release has been provided in order to provide shareholders and potential investors with a more complete perspective on the Company’s current and future operations and such information may not be appropriate for other purposes. There is no representation by the Company that actual results achieved will be the same in whole or in part as those referenced in the forward-looking statements and the Company does not undertake any obligation to update publicly or to revise any of the included forward-looking statements, whether as a result of new information, future events or otherwise, except as may be required by applicable securities law.
Financial Outlook
This press release contains future-oriented financial information and financial outlook information (collectively, “FOFI“) about the financial results the quarter ended March 31, 2023, and the year ended December 31, 2022, including net sales, gross margin, and Adjusted EBITDA, all of which are subject to the same assumptions, risk factors, limitations, and qualifications as set out under the heading “Forward-Looking Information”. The actual financial results of the Company may vary from the amounts set out herein and such variation may be material. The Company and its management believe that the financial outlook has been prepared on a reasonable basis, reflecting management’s best estimates and judgments and the FOFI contained in this press release was approved by management as of the date hereof. However, because this information is subjective and subject to numerous risks, it should not be relied on as necessarily indicative of future results. Except as required by applicable securities laws, the Company undertakes no obligation to update such FOFI. FOFI contained in this press release was made as of the date hereof and was provided for the purpose of providing further information about the Company’s anticipated future business operations on a quarterly and annual basis. Readers are cautioned that the FOFI contained in this press release should not be used for purposes other than for which it is disclosed herein.

SOURCE Simply Better Brands Corp
This article was published by CFN Enterprises Inc. (OTCQB: CNFN), owner and operator of CFN Media, the industry’s leading agency and digital financial media network dedicated to the burgeoning CBD and legal cannabis industries. Call +1 (833) 420-CNFN for more information.
About Ryan Allway
Mr. Allway has over a decade of experience in the financial markets as both a private investor and financial journalist. He has been actively involved in the cannabis industry since its inception, covering public and private companies.
Search CannabisFN
Press Coverage

Psychedelics Index
Top Videos

Alan Brochstein’s 420 Investor is the go-to community for investors to learn, explore, and profit from the marijuana companies. The main goal of 420 Investor is to provide real-time, objective information about the top marijuana companies in the market in order to help investors capitalize on cannabis.

In addition to his role as Founder and CEO at MAZAKALI, Sumit is a consultant to The Arcview Group and the Managing Partner of Emerald Ventures. A frequent speaker at investment seminars, Sumit acts as a mentor to Arcview and Canopy companies and serves on the Canopy Investment committee as well as the NCIA Finance […]

THC is an ACMPR Licensed Producer and Canada’s largest supplier of legal Cannabis Genetics.

Indiva aims to become a house of global marijuana brands, recognized for high quality cannabis products.
Network Partners
About CFN Media Group
CFN Enterprises Inc. (OTCQB: CNFN) owns and operates CFN Media Group, the premier agency and financial media network reaching executives, entrepreneurs and consumers worldwide. Through its proprietary content creation, video library, and distribution via www.CannabisFN.com, CFN has built an extensive database of cannabis interest, assisting many of the world’s largest cannabis firms and CBD brands to build awareness and thrive. For more information, please visit www.cfnenterprisesinc.com.

Disclaimer: Matters discussed on this website contain forward-looking statements that are subject to certain risks and uncertainties that could cause actual results to differ materially from any future results, performance or achievements expressed or implied by such statements. CFN Media Group, which owns CannabisFN, is not registered with any financial or securities regulatory authority and does not provide nor claims to provide investment advice or recommendations to readers of this release. CFN Media Group, which owns CannabisFN, may from time-to-time have a position in the securities mentioned herein and will increase or decrease such positions without notice. The Information contains forward-looking statements, i.e. statements or discussions that constitute predictions, expectations, beliefs, plans, estimates, or projections as indicated by such words as "expects", "will", "anticipates", and "estimates"; therefore, you should proceed with extreme caution in relying upon such statements and conduct a full investigation of the Information and the Profiled Issuer as well as any such forward-looking statements. Any forward looking statements we make in the Information are limited to the time period in which they are made, and we do not undertake to update forward looking statements that may change at any time; The Information is presented only as a brief "snapshot" of the Profiled Issuer and should only be used, at most, and if at all, as a starting point for you to conduct a thorough investigation of the Profiled Issuer and its securities and to consult your financial, legal or other adviser(s) and avail yourself of the filings and information that may be accessed at www.sec.gov, www.pinksheets.com, www.otcmarkets.com or other electronic sources, including: (a) reviewing SEC periodic reports (Forms 10-Q and 10-K), reports of material events (Form 8-K), insider reports (Forms 3, 4, 5 and Schedule 13D); (b) reviewing Information and Disclosure Statements and unaudited financial reports filed with the Pink Sheets or www.otcmarkets.com; (c) obtaining and reviewing publicly available information contained in commonlyknown search engines such as Google; and (d) consulting investment guides at www.sec.gov and www.finra.com. You should always be cognizant that the Profiled Issuers may not be current in their reporting obligations with the SEC and OTCMarkets and/or have negative signs at www.otcmarkets.com (See section below titled "Risks Related to the Profiled Issuers, which provides additional information pertaining thereto). For making specific investment decisions, readers should seek their own advice and that of their own professional advisers. CFN Media Group, which owns CannabisFN, may be compensated for its Services in the form of cash-based and/or equity-based compensation in the companies it writes about, or a combination of the two. For full disclosure, please visit: https://www.cannabisfn.com/legal-disclaimer/. A short time after we acquire the securities of the foregoing company, we may publish the (favorable) information about the issuer referenced above advising others, including you, to purchase; and while doing so, we may sell the securities we acquired. In addition, a third-party shareholder compensating us may sell his or her shares of the issuer while we are publishing favorable information about the issuer. Except for the historical information presented herein, matters discussed in this article contain forward-looking statements that are subject to certain risks and uncertainties that could cause actual results to differ materially from any future results, performance or achievements expressed or implied by such statements. CFN Media Group, which owns CannabisFN, is not registered with any financial or securities regulatory authority, and does not provide nor claims to provide investment advice or recommendations to readers of this release. CFN Media Group, which owns CannabisFN, may from time to time have a position in the securities mentioned herein and will increase or decrease such positions without notice. For making specific investment decisions, readers should seek their own advice and that of their own professional advisers. CFN Media Group, which owns CannabisFN, may be compensated for its Services in the form of cash-based and/or equity- based compensation in the companies it writes about, or a combination of the two. For full disclosure please visit: https://www.cannabisfn.com/legal-disclaimer/.
Copyright © Accelerize Inc. · All Rights Reserved · Privacy Policy · Legal Disclaimer

